Neural Networks 101: Part 9

Regression
Regression in Deep Learning is a type of Model that will output a continuous value instead of a discrete value e.g. classifying some ouptut as a certain label.
Examples of applications and outputs of a Regression model are house prices, co-ordinates, air temperature.
These outputs span a continuous range, potentially from negative to positive without an inherent limit but obviously, there would need to be a practical limit to the range of an output.
In this blog post, we’ll go through sample code of a Regression model. This model identifies the centre of a persons face in an image, returning the x,y coordinates.
Example Code
This example downloads the BIWI_HEAD_POSE data set. This dataset contains images of people and corresponding text files that contains the co-ordinates for the centre of their faces.
from fastai.vision.all import *
path = untar_data(URLs.BIWI_HEAD_POSE)

img_files = get_image_files(path)

# The ...post.txt files contains co-ordinates corresponding to the same image with the centre of the persons face.
def img2pose(image_file):
    return Path(f'{str(image_file)[:-7]}pose.txt')

cal = np.genfromtxt(path/'01'/'rgb.cal', skip_footer=6)

def get_centre(image_file):
    centre = np.genfromtxt(img2pose(image_file), skip_header=3)
    c1 = centre[0] * cal[0][0]/centre[2] + cal[0][2]
    c2 = centre[1] * cal[1][1]/centre[2] + cal[1][2]
    return tensor([c1,c2])

biwi = DataBlock(
    blocks=(ImageBlock, PointBlock),
    get_items=get_image_files,
    get_y=get_centre,
    splitter=FuncSplitter(lambda o: o.parent.name=='13'),
    batch_tfms=[*aug_transforms(size=(240,320)), Normalize.from_stats(*imagenet_stats)]
)

data_loaders = biwi.dataloaders(path)

learn = cnn_learner(data_loaders, resnet18, y_range=(-1, 1))

lr = 0.0030199517495930195
learn.fine_tune(3, lr)
Below are x,y co-ordinate of the labels which indicate the centre of a face in a picture:
TensorPoint([[-0.0151, 0.0303]], device='cuda:0')
When the Model trains, the output will become an x,y co-ordinate of the predicted location of the face.
Since this is a Regression model, the x and y coordinate are continuous values.
Here are some important things to note in the example and for Regression in general.
Mean Squared Error Loss Function
MSE (Mean Squared Error) Loss Function is usually used due to its ability to measure the predicted values vs the true continuous values
This loss function amplifies the error or difference between the truth label and the prediction through squaring. This also ensures both positive and negative errors contribute to the total error.
$ \text{MSE} = \frac{1}{N} \sum_{i=1}^{N} (y_i - \hat{y}_i)^2 $
Remember from previous articles:
Y “hat” is the prediction:
$ \hat{y}_i $
Each target (the true label):
$ y_i $
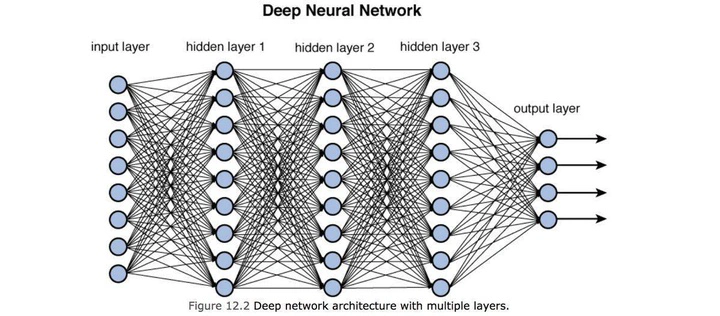
No Activation Functions in the final layer
Regression models typically do not have an activation function (or non-linear function) in the final layer. This is due to requiring a continuous value as the final output.
Summary
- Regression models are typically used when an output needs to be a continuous value e.g. house price, temperature, co-ordinates
- Regression models usually use the Mean Squared Error Loss function to represent a continious value for the loss and do not have a non-linear (activation) function before the final layer